
https://www.truconbd.com/products-store
Strategic Management Newsletter Registration
Strategic Leadership Origins

Competitive Intelligence Template
Dr. Gary D. Seale
The Trucon Consulting Group, LLC
Austin, TX
512-529-7045
April 15, 2026
Contents
1. Competitive Intelligence………………………………………………………………..3
2. Financial and Operational Benchmarks………………………………………………6
3. Product and Market Sentiment……………………………………………………… 9
4. Talent & Internal Health – Competitive Research Analysis………………………. 11
5. Strategic “Battlecard” – Competitive Research Analysis…………………………..12
1. Competitive Intelligence
Reflecting back on my 18 years spent in the industrial distribution business, 12 years representing a Fortune 500 manufacturing company and almost two decades as a provider of sales and consulting services, I’m aware of the issues required to generate and maintain a competitive edge in the marketplace. As a sales manager, I only had a general idea of what my competitors could offer, what were their weaknesses and competitive strengths and the macro effects influencing the current marketplace.
During the early part of my career those numbers were very difficult to determine, especially since many of those firms were privately held. Now with the advent of the digital age, database companies and AI, this competitive information can be compiled to obtain a much better grasp of where your competitors are directing their efforts.
A strategic competitive intelligence report can be separated into five different categories.
- The Executive Summary
- The bottom line: What issues exist that threaten goals and profit margins? Examples:
- Cost and capability to produce
- Customer acquisition costs
- Competitor/product entry
- Supply chain constraints
- Sales and marketing issues
- Technology concerns
- IT capability
- Employee retention
- Intellectual property
- Working capital constraints
- How do you categorize and define issues in understandable terms?
- What opportunities exist that need to be analyzed before they cease to be viable? (AI implementation, New market entry, Technology innovation, etc, etc.)
- Urgency level: Low, Medium, High. A timing and resource allocation decision. Can you apply a return on investment calculation?
Here’s the Return on Investment (ROI) formula in its cleanest form:
- ROI tells you how much you earned (or project to earn) relative to what you spent.
- You take the net profit (what you gained minus what you spent), divide it by the original cost, and convert it to a percentage.
- ROI = Net Profit/Cost of Investment X 100 = ____%
- A higher ROI means the investment was more efficient or profitable.
Develop SWOT analysis specifically designed for the stated area of concern.
(Strengths, weaknesses, opportunities, threats)
Recommended Responses. Examples:
- Tech expertise (AI adoption)
- Expense control
- New products
- Expansion into new industries / geographies
- Sales and marketing campaigns
- Manufacturing production efficiencies
- IT security
Be aware of the resources required to address the issue:
- People expertise
- Equipment
- Product
- Facility
- Software
- Supply chain
- Financial
2. Financial and Operational Benchmarks
Here’s a structured four-column chart that compares key financial and operational benchmarks for a hypothetical company offering both digital and tangible products:
| Metric | Your Company / Capabilities | Competitor Benchmark | Variance / Insight |
| Revenue Growth Rate (%) | 18% YoY driven by digital scalability and recurring subscriptions | 12% YoY with heavier reliance on physical product sales | +6% advantage shows strong digital leverage and recurring income strength |
| Gross Margin (%) | 62% blended (85% digital, 35% physical) | 48% blended | Higher margin reflects optimized digital mix; opportunity to further reduce COGS on physical goods |
| Customer Acquisition Cost (CAC) | $42 per customer via organic + targeted ads | $65 per customer | Lower CAC indicates stronger brand positioning and efficient marketing funnel |
| Customer Lifetime Value (LTV) | $420 due to subscriptions and upsells | $310 | Higher LTV suggests better retention and monetization strategy |
| LTV:CAC Ratio | 10:1 | 4.8:1 | Significant efficiency advantage; room to scale marketing spend aggressively |
| Inventory Turnover (Physical Goods) | 6.5x annually | 4.2x annually | Faster turnover reduces holding costs and risk of obsolescence |
| Digital Product Delivery Cost | Near $0 marginal cost | Low but includes platform fees (~5–10%) | Competitive parity, but slight advantage if platform independence is maintained |
| Conversion Rate (%) | 4.8% website conversion | 3.1% | Strong UX, messaging, and offer alignment |
| Average Order Value (AOV) | $78 through bundling digital + physical | $61 | Bundling strategy is outperforming competitor’s single-product focus |
| Refund / Return Rate | 3% digital, 8% physical | 6% digital, 12% physical | Better product-market fit and clearer expectations reduce returns |
| Operational Efficiency (Revenue per Employee) | $285K per employee | $210K per employee | Leaner operations and automation driving productivity gains |
| Fulfillment Time (Physical Goods) | 2.1 days average | 3.8 days | Faster delivery improves customer satisfaction and retention |
| Recurring Revenue (%) | 38% of total revenue | 22% | Strong subscription model stabilizes cash flow |
| Marketing ROI | 4.5x return on spend | 2.9x return | More effective campaign targeting and funnel optimization |
| Churn Rate (%) | 4.5% monthly (subscriptions) | 7.2% monthly | Better customer experience and ongoing value delivery |
| Platform Dependency Risk | Low (owned channels + email list) | Medium–High (third-party marketplaces) | Reduced risk exposure and higher margin control |
| Product Development Cycle Time | 4–6 weeks digital, 3–4 months physical | 8–10 weeks digital, 5–6 months physical | Faster innovation cycle creates competitive agility |
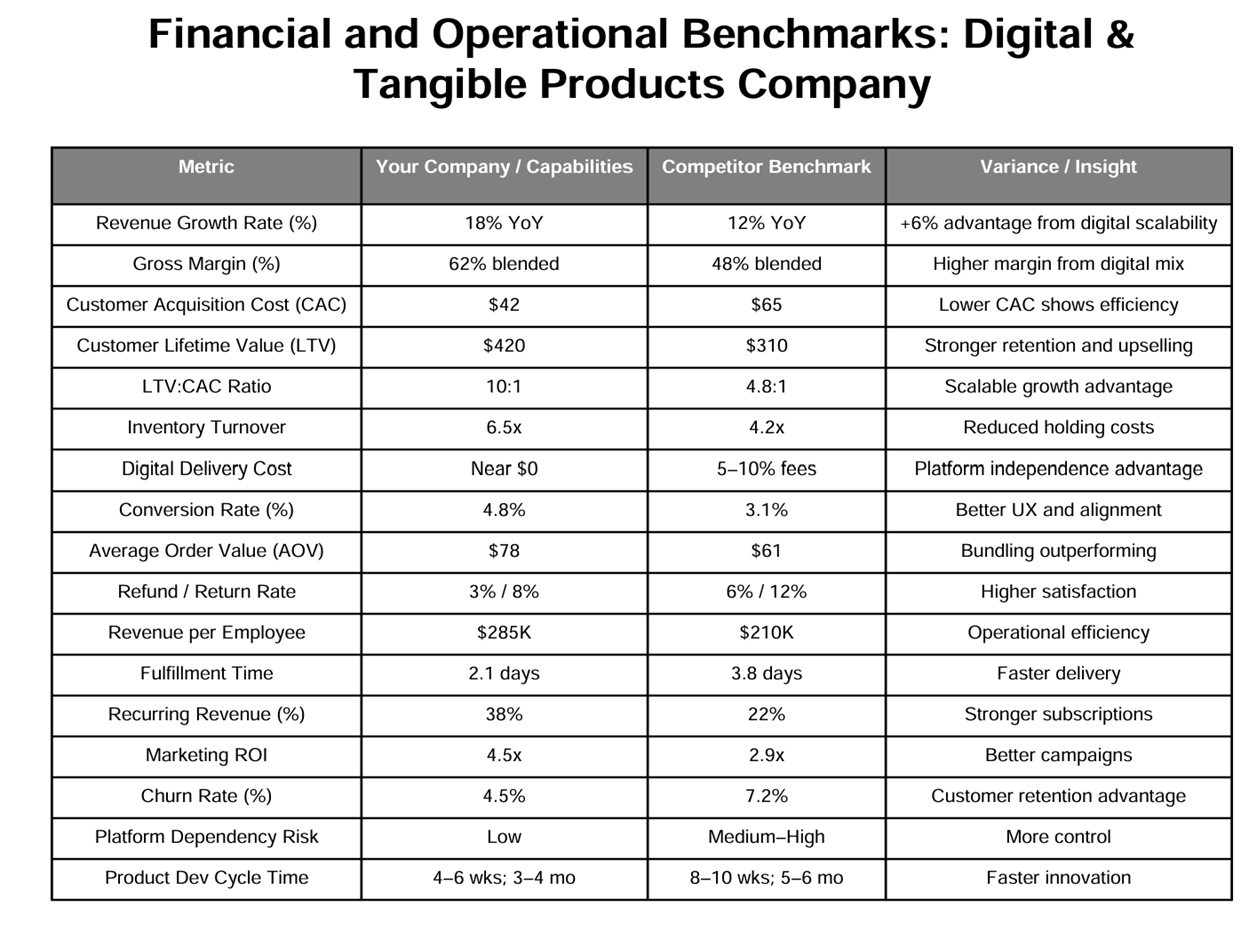
Key Takeaways & Strategic Insights
- Digital leverage is the primary advantage: Higher margins, lower delivery cost, and scalability are driving superior financial performance.
- Customer economics are significantly stronger: A high LTV:CAC ratio signals the ability to safely increase marketing investment to accelerate growth.
- Operational excellence matters: Faster fulfillment and higher inventory turnover reduce cost drag and improve customer satisfaction.
- Recurring revenue is a stabilizer: Subscription-based offerings create predictability and increase enterprise value.
- Competitor gap = growth opportunity: The largest differences (LTV:CAC, margins, and conversion rates) suggest areas where continued investment will widen the moat.
3. Product and Market Sentiment
The current product and market sentiment reflects a competitive environment where customer expectations are rapidly evolving, driven by digital transparency, speed of service, and value-added capabilities. While the company maintains a solid foundation built on industry experience and established customer relationships, there are several hypothetical feature gaps and customer concerns that may impact long-term competitiveness if not addressed.
Feature Gaps
From a product perspective, the most notable gaps center around digital enablement and value-added services. Customers increasingly expect real-time inventory visibility, seamless e-commerce ordering, and predictive analytics that support procurement planning. If competitors are offering integrated digital platforms with automated quoting, order tracking, and AI-driven recommendations, the absence of these capabilities creates friction in the buying process. Additionally, limited customization options or slow product innovation cycles may position the company as reactive rather than proactive in meeting specialized customer needs.
Another potential gap lies in post-sale support. Competitors who provide enhanced technical support, training resources, and lifecycle management tools may gain a stronger foothold with customers seeking long-term partnerships rather than transactional relationships.
Customer Issues and Pain Points
Customer sentiment suggests that reliability and responsiveness remain critical decision drivers. Common hypothetical issues include inconsistent lead times, lack of proactive communication during supply chain disruptions, and pricing opacity. In an environment where customers are under pressure to control costs and maintain operational efficiency, delays or uncertainty can significantly erode trust.
Furthermore, customers may perceive a disconnect between sales promises and operational execution. If internal systems are not fully aligned—particularly across sales, inventory management, and logistics—this can result in order inaccuracies or delayed fulfillment. Over time, these issues contribute to customer attrition, even if the core product quality remains strong.
There is also a growing expectation for consultative engagement. Customers are not only purchasing products but also seeking expertise. A perceived lack of strategic insight or industry guidance from the sales team may push clients toward competitors who position themselves as advisors rather than vendors.
Win/Loss Analysis vs. Competition
A hypothetical win/loss analysis reveals clear patterns in competitive positioning. Wins are typically secured when the company leverages its strengths in relationship management, pricing competitiveness, and product reliability. Long-standing customer relationships and trust often serve as decisive factors, particularly in accounts where switching costs are high.
However, losses tend to occur in scenarios where speed, technology, and perceived innovation are prioritized. Competitors with advanced digital tools, faster response times, and more agile supply chains are winning new business, especially among younger procurement teams who value efficiency and data-driven decision-making.
In competitive bids, the company may also lose when customers require bundled solutions or integrated services that extend beyond the core product offering. Competitors that package products with analytics, financing options, or managed services create a more compelling value proposition.
Another critical factor in losses is differentiation. When the company’s offering is perceived as similar to competitors, purchasing decisions often default to price or convenience. Without a clearly articulated unique value proposition, even strong incumbency can be challenged.
Overall Sentiment Insight
The overarching market sentiment indicates that while the company remains credible and competitive, it is at risk of gradual erosion in market share if it does not evolve alongside customer expectations. The shift toward digital integration, service differentiation, and consultative selling is not a future trend—it is a current requirement.
Addressing these gaps presents a meaningful opportunity. By aligning product development, customer experience, and sales strategy with emerging market demands, the company can transition from a position of defending market share to actively expanding it.Top of Form
4. Talent & Internal Health – Competitive Research Analysis
A structured “Shadow” Turnover Risk Assessment provides critical insight into a competitor’s internal stability and future performance trajectory. Talent health is often a leading indicator of innovation capacity, execution quality, and customer satisfaction. This analysis focuses on three key dimensions: employee sentiment, leadership continuity, and hiring patterns.
First, sentiment trends derived from platforms such as Glassdoor and LinkedIn commentary reveal underlying cultural health. Consistently declining ratings, negative commentary around leadership, or recurring themes such as burnout and lack of direction suggest systemic issues. These environments typically slow innovation cycles and create operational friction, which can be exploited competitively. Conversely, stable or improving sentiment signals alignment and resilience, requiring a more differentiated strategic approach.
Second, key departures—particularly at the C-suite and senior engineering levels—offer strong signals of disruption. Executive turnover in roles such as Chief Technology Officer, Chief Revenue Officer, or Head of Product often indicates strategic disagreement, missed performance targets, or pending transformation initiatives. Mapping the timing and frequency of these exits allows us to infer whether the competitor is in reactive mode or executing a planned evolution. Clusters of departures, especially within technical teams, may also indicate stalled product development or architectural challenges.
Third, analyzing target hiring patterns reveals forward-looking strategy. By tracking job postings, recruiter activity, and lateral hires, we can identify where the competitor is investing. For example, aggressive hiring in AI, customer success, or enterprise sales may indicate a pivot toward higher-value offerings or new market segments. Additionally, identifying source companies for new hires highlights whom they consider best-in-class talent pools—and whether they are attempting to replicate a competitor’s capabilities.
Synthesizing these three elements creates a comprehensive view of internal health. A competitor experiencing declining sentiment, leadership churn, and reactive hiring is likely vulnerable to disruption. This insight enables proactive positioning: accelerating sales engagement, emphasizing stability and execution strength, and targeting accounts that may be experiencing service degradation. Ultimately, talent intelligence transforms internal competitor data into actionable market advantage.
5. Strategic “Battlecard” – Competitive Research Analysis
The Strategic Battlecard translates competitive intelligence into frontline execution, equipping sales and operations teams with precise, situational tactics. Its effectiveness depends on clarity, timing, and alignment with real customer concerns. This framework focuses on three actionable components: when to attack, when to defend, and the deployment of a “killer” question.
The “When to Attack” strategy identifies moments of maximum competitive vulnerability. These are typically triggered by known weaknesses—such as limited support coverage, slow implementation cycles, or inconsistent service delivery. For example, if a prospect currently relies on a competitor with restricted service hours, positioning a 24/7 support model becomes a direct and relevant differentiator. The key is contextual precision: attacks must align with the prospect’s lived experience, not generic claims. Well-timed offensive positioning accelerates deal momentum by reframing dissatisfaction into urgency.
Conversely, “When to Defend” prepares teams to neutralize common objections rooted in competitor strengths. A frequent scenario involves price competition. If a competitor offers a lower entry point, the response should pivot to total cost of ownership (TCO), emphasizing hidden costs such as implementation delays, add-on fees, or scalability limitations. The goal is not to dismiss the competitor’s advantage, but to recontextualize it within a broader value framework. Effective defense maintains credibility while shifting the evaluation criteria.
The most powerful element is the “Killer” Question—designed to subtly introduce doubt and provoke deeper evaluation. This question should be open-ended, insight-driven, and difficult for the competitor to counter. For example: “How confident are you in their ability to support your growth over the next 24 months without requiring a platform change?” This approach avoids direct criticism while encouraging the prospect to reflect on risk, scalability, and long-term alignment.
When integrated, these components create a dynamic sales tool that adapts to real-time conversations. The battlecard ensures consistency across the team while allowing for situational flexibility. Ultimately, it transforms competitive knowledge into strategic influence—guiding prospects toward decisions based not just on features or price, but on confidence, risk mitigation, and long-term value.
Courtesy of:
Dr. Gary D. Seale | The Trucon Consulting Group, LLC | www.truconbd.com | GDS@truconbd.com | 512-529-7045
Top of Form
Bottom of Form
Bottom of Form
The P.E.A.R. Process
The Iterative Cycle of Success: Planning, Execution, Evaluation, Adjustment, and Re-Execution in SMEs
By: Dr. Gary D. Seale – Doctorate in Strategic Management – Liberty University – 2025
January 6, 2026
In the dynamic landscape of small and medium-sized enterprises (SMBEs), where resources are limited and market conditions fluctuate rapidly, adopting a structured yet flexible approach to operations is crucial for sustained growth. The iterative cycle of Planning, Execution, Evaluation, Adjustment, and Re-Execution—often abbreviated as PEAR—serves as a powerful framework for navigating these challenges.
Unlike rigid strategies that falter in uncertainty, PEAR emphasizes adaptability, learning, and continuous improvement, drawing parallels to lean methodologies like PDCA (Plan-Do-Check-Act). For SMBEs, this cycle is not just a theoretical model but a practical lifeline that optimizes decision-making, minimizes risks, and drives innovation. The cycle begins with Planning, the foundational phase where SMBEs define objectives, allocate resources, and outline actionable steps. In a business context, this involves market analysis, setting SMART (Specific, Measurable, Achievable, Relevant, Time-bound) goals, and forecasting potential obstacles.
For instance, a boutique e-commerce startup might plan a product launch by researching consumer trends via tools like Google Analytics, budgeting for digital marketing, and identifying key performance indicators (KPIs) such as conversion rates. Effective planning ensures alignment with the company’s vision while accounting for limited budgets typical in SMEs. Without it, efforts can scatter, leading to wasted resources—a common pitfall for entrepreneurs juggling multiple roles.
Following planning is Execution, where ideas transform into actions. This phase demands discipline and agility, as SMBEs often operate with lean teams. Execution involves implementing the plan with precision, such as rolling out a marketing campaign or streamlining supply chains. Take a privately-owned manufacturing firm: after planning to adopt automation, execution might include training staff on new software and integrating it into daily workflows. Success here relies on clear communication and empowerment of employees, fostering a culture where frontline workers can contribute insights.
However, execution isn’t flawless; real-world variables like supply disruptions or competitor moves can arise, underscoring the need for the subsequent steps. Evaluation is the critical checkpoint, where SMBEs assess outcomes against predefined Key Performance Indicators. This involves data collection and analysis to measure what worked and what didn’t. Tools like dashboards in CRM systems or simple Excel trackers help quantify results—did sales increase by the targeted 20%?
Qualitative feedback from customers and teams adds depth. For an SMBE restaurant chain, evaluation might reveal that a new menu item boosted foot traffic but strained kitchen efficiency. Honest evaluation prevents complacency and highlights inefficiencies, turning data into actionable intelligence. Based on insights, Adjustment refines the approach. This adaptive phase encourages SMBEs to pivot without overhauling everything, preserving momentum. Adjustments could be minor tweaks, like reallocating ad spend, or major shifts, such as product redesign.
In our e-commerce example, if evaluation shows low engagement, adjustments might involve A/B testing website layouts or partnering with influencers. This step embodies resilience, a hallmark of successful SMBEs that thrive amid economic volatility.
Finally, Re-Execution closes the loop by relaunching the refined plan, perpetuating the cycle. It’s not repetition but evolution, building on lessons learned. Over time, this iterative process compounds advantages, enabling SMBEs to scale efficiently. A tech consultancy might re-execute a client acquisition strategy after adjustments, leading to higher retention rates.
In conclusion, the PEAR cycle empowers SMBEs to operate like agile startups, even as they mature. By embedding this framework into daily operations, businesses foster innovation, reduce failure costs, and achieve long-term viability. In an era of rapid change—driven by AI, globalization, and consumer shifts—SMBEs that master PEAR don’t just survive; they lead. Embracing this cycle transforms challenges into opportunities, proving that strategic iteration is the true engine of business success.

Key Measurement Metrics
Key Metrics Every Mid-Size SMBE in Manufacturing or Services Must Track
Small and medium business enterprises (SMBEs) with 50–500 employees operate in a margin-sensitive world where every percentage point of efficiency or waste can determine survival. Unlike startups chasing vanity metrics or enterprises drowning in big data, mid-size firms need a focused dashboard of 8–12 indicators that directly tie to cash flow, customer retention, and operational leverage. The goal is not more data—it is the right data, measured consistently, and acted upon quarterly. Below are the seven most critical categories, with specific KPIs, benchmarks, and collection methods tailored to manufacturing (e.g., machined parts, assembly) and service (e.g., field maintenance, IT consulting) firms.
1. Cash-to-Cash Cycle Time Manufacturing: Days Inventory Outstanding (DIO) + Days Sales Outstanding (DSO) – Days Payables Outstanding (DPO)
Services: DSO – DPO (inventory is usually zero)
Why it matters: A mid-size fabricator with $8 M revenue and 45-day terms can free $500 k in working capital by shaving five days off the cycle.
Target: < 60 days total.
How to measure: Export aged receivables/payables from QuickBooks or NetSuite; pull inventory turns from MRP/ERP. Update weekly.
2. Gross Margin Return on Inventory (GMROI) – Manufacturing Only Formula: (Gross Margin % × Annual Revenue) ÷ Average Inventory Value
Why it matters: Tells you if slow-moving SKUs are eating floor space and capital. A metal-stamping shop discovered 22% of SKUs generated 78% of margin; the rest were liquidated.
Target: > 2.5×
How to measure: COGS report + perpetual inventory count; reconcile monthly.3. Revenue per Full-Time Equivalent (FTE) – Services & Shared Formula: Trailing 12-month revenue ÷ average headcount
Why it matters: A 120-person HVAC service firm targeting $150 k/FTE knows immediately when utilization slips below billable-hour targets.
Target: $140 k–$180 k depending on labor intensity.
How to measure: Payroll export + P&L; exclude owners if they draw no salary.
4. Customer Retention Rate (CRR) & Net Promoter Score (NPS) CRR Formula: ((Customers at end of period – New customers) ÷ Customers at start) × 100
Why it matters: Replacing a $50 k/year contract costs 5–7× more than keeping it. Manufacturing OEMs live or die by multi-year blanket orders; service firms by renewal rates.
Target: > 85 % annual CRR; NPS > 50.
How to measure: CRM churn report + quarterly two-question survey (“How likely to recommend? Why?”).
5. On-Time In Full (OTIF) – Manufacturing / On-Time Service Delivery (OTSD) – Services OTIF: % of customer orders shipped complete and on the promised date.
Why it matters: Late shipments trigger chargebacks (1–3 % of invoice) and lost re-orders.
Target: > 95 %.
How to measure: Shipping manifest vs. PO acknowledgment; flag partials.
6. Overall Equipment Effectiveness (OEE) – Manufacturing Only Formula: Availability × Performance × Quality
Why it matters: A CNC shop running at 65 % OEE versus industry 85 % is leaving $600 k on the table at $12 M revenue.
Target: World-class = 85 %; mid-size realistic = 75 %.
How to measure: IoT sensors or manual downtime logs; calculate daily.
7. Contribution Margin per Constraint Hour Identify the true bottleneck—usually a skilled trade, specialized machine, or senior consultant—then calculate revenue minus variable costs per hour of that constraint.
Why it matters: Guides pricing, outsourcing, and capital expenditure. A plastics molder raised prices 18 % on high-runner parts once they realized the injection press was the constraint, not labor.
How to measure: Standard costing module + capacity log. Implementation Framework
Centralize: Push all seven KPIs into a single Power BI or Google Data Studio dashboard updated no less than monthly.
Assign owners: CFO owns cash cycle; plant manager owns OEE/OTIF; service delivery head owns utilization and OTSD.
Set thresholds: Green/yellow/red gates trigger mandatory review in the monthly ops meeting.
Close the loop: Every red metric must have a 30-day corrective action plan with an owner and budget.
Mid-size SMBEs that measure only revenue and EBITDA are flying blind. The seven metrics above form a closed-loop system: cash cycle funds inventory and labor; inventory and labor drive delivery; delivery drives retention; retention drives predictable cash. Master these, and growth becomes a choice rather than a hope.
Four Takeaway Metrics Summary
- Track Cash-to-Cash Cycle (< 60 days) to unlock working capital without new debt.
- Measure Revenue per FTE ($140 k–$180 k) and Contribution per Constraint Hour to price and schedule profitably.
- Demand > 95 % OTIF/OTSD and > 85 % CRR to eliminate chargebacks and sales churn.
- Push OEE to 75 %+ and GMROI to 2.5× (manufacturing) to turn fixed assets into cash engines.
Strategic Management Analysis
By: Dr. Gary D. Seale
The Trucon Consulting Group, LLC
The need for a strategic management analysis may be required for a multitude reasons. They include the need for ongoing competitive analysis, a loss of revenue, a dramatic shift in your industry, the worldwide economy, or feedback from trusted associates. The specific area of concern must be recognized to determine the standards of performance for that segment of the business. If significant areas of underperformance are recognized, then research and a root cause analysis should be performed to establish viable benchmarks. The goal is to be as objective as possible to create realistic action plans. This can be accomplished by a method call triangulation. Just as a Global Positioning System (GPS) requires three geographic points to be accurate, business research requires an investigation into verified existing literature, followed by qualitative and quantitative research. The researcher must be aware of their own biases to reduce the prejudices that creep into an investigation. This potential bias is called bracketing. Objectivity is paramount in the effort to serve your organization.
The first step is an extensive literature search. The extant literature is found in academic and technical journals typically published within the last five years. This relatively inexpensive method will yield in depth articles germane to the area of interest. Google Scholar is a good place to begin a literature research effort (https://scholargoogle.com). You will discover free information that took hundreds of hours of research, analysis and writing on demand. Simply start your search with broadly named queries and continue to narrow down the titles until you discover appropriate articles. A literature search may save you countless hours of investigation and the expense associated with the effort.
Qualitative analysis is the second step in the research effort. IT involves examining non-numerical data, such as text, images, or observations, to identify patterns, themes, or meanings. It focuses on understanding the context, perspectives, or behaviors behind the data, often using methods like interviews, focus groups, or content analysis to derive insights. This allows the researcher to discover a greater understanding of the issues beyond what a metrics only investigation might yield. This reveals the emotions and history that drive the decision making in an organization. It brings fears and negative consequences into the spotlight that may not present themselves in a quantitative research effort. Qualitative research can be categorized into nodes of information that allows the decision makers to grasp the quality of the feedback derived from this type of research. It aids with a deeper understanding of the perceived barriers to progress. This understanding opens the doors to conceptualize a superior plan for solutions that genuinely solve problems.
Quantitative analysis the third step in the analysis effort. It is a systematic approach to evaluating numerical data to inform decision-making, often used in finance, economics, and research. It involves collecting, processing, and analyzing measurable data to identify patterns, trends, or relationships. Techniques include statistical modeling, regression analysis, and data visualization to derive insights. For example, in finance, it is used to assess investment risks or forecast market trends. By relying on objective metrics, quantitative analysis minimizes bias, enabling precise predictions and strategic planning. Tools like Python, R, or Excel are commonly employed to manage large datasets, ensuring robust, evidence-based conclusions in complex scenarios.
For intercompany quantitative research, the use of a survey tool using probing questions and responses taken with a Likert scale response are useful. The five potential responses reveal the gamut of potential answers and still allow a quantitative evaluation with a descriptive analysis report and a bar graph for visualization. A descriptive analysis report can be obtained with most AI platforms. Graphical illustrations are readily obtained using MS Excel software.
The fourth step is to determine where there is a gap between the current performance and the desired performance. This objective evaluation helps the strategic management team to develop action plans that address the issues uncovered during the gap analysis. These actions plans will need to be prioritized for their return on investment potential. After the evaluation phase, the fifth step is to develop a thorough change plan to be implemented to ensure that the new methods or approach will be implemented in the organization. Be aware that change can be very difficult for some people. A thorough plan for communicating the reasons for the change must be implemented. Sell the benefits for the changes to not only the company, but the company associates as well. Be aware that effective change does not come on a rapid basis. Your change team should have the power and authority to enforce and influence change until it becomes an ingrained part of your company culture.
Summary
The systematic approach of conducting a literature search, performing qualitative research and quantitative research are the three methods of extracting valuable information. This is called triangulation. It is used to ensure the most objective analysis possible for your organization. It involves outside expertise, insider experience, and anonymous surveys and scientific experiments to capture the breath of information required to make the best strategic management decisions for your organization. The gap analysis helps to generate actions plans that aid in creating a competitive edge that is necessary for long-term business survival.
Gary Seale understands how important your time and business are to you as an owner or senior manager of the organization. This system offers an outside perspective built on these analytical tools and decades of business experience. Don’t hesitate to contact me to discuss your business situation and determine if an engagement with the Trucon Consulting Group could create a net advantage for your company.
Dr. Gary D. Seale – Strategic Management
The Trucon Consulting Group, LLC
www.truconbd.com 512-529-7045
Bridging the Gap Between Internal Teams and External Stakeholders
Compilation of Gary D. Seale – Trucon Consulting & GROK
In today’s fast-paced business environment, effective collaboration between internal teams and external stakeholders—such as clients, partners, vendors, or investors—is critical for organizational success. Miscommunication, misaligned goals, or lack of transparency can create friction, leading to missed opportunities or project failures. Bridging this gap requires intentional strategies that foster trust, streamline communication, and align expectations. By prioritizing clear processes and leveraging technology, organizations can create a seamless flow of information and build stronger relationships.
One key to bridging the gap is establishing clear communication channels. Internal teams must maintain consistent messaging when interacting with external stakeholders to avoid confusion. Regular updates through shared platforms, like project management tools or collaborative software, ensure everyone stays informed. For example, tools like Slack or Asana allow real-time updates, reducing the risk of miscommunication. Additionally, designating a point of contact, such as a project manager, helps streamline interactions and ensures accountability. Transparency is equally vital. External stakeholders often lack insight into internal processes, which can lead to distrust or unrealistic expectations. By sharing relevant progress reports, timelines, and challenges, internal teams can build credibility and foster collaboration.
For instance, a quarterly report or a shared dashboard can provide stakeholders with a clear view of project milestones, enhancing trust. Another critical factor is aligning goals. Internal teams may prioritize operational efficiency, while stakeholders might focus on ROI or timely delivery. Regular alignment meetings, such as kickoff calls or progress reviews, help clarify objectives and ensure all parties work toward shared outcomes. These meetings also provide a forum to address concerns early, preventing costly misunderstandings. Cultural and contextual awareness also plays a role. External stakeholders may operate in different industries, regions, or time zones, which can create disconnects. Internal teams should adapt their communication style to suit stakeholders’ preferences, whether through formal reports or informal check-ins. Understanding these nuances builds rapport and strengthens partnerships. Finally, feedback loops are essential. Actively seeking input from external stakeholders and incorporating it into internal processes demonstrates respect and fosters collaboration. Surveys, feedback forms, or post-project reviews can provide valuable insights for improvement. By implementing these strategies, organizations can bridge the gap between internal teams and external stakeholders, creating a cohesive ecosystem that drives success.
Key Points:
Clear Communication: Use shared tools and designate a point of contact to streamline interactions.
Transparency: Share progress reports and dashboards to build trust and manage expectations.
Goal Alignment: Hold regular meetings to ensure internal and external priorities align.
Cultural Awareness: Adapt communication to stakeholders’ contexts for better rapport.
Feedback Loops: Incorporate stakeholder input to improve processes and collaboration.
Define external stakeholders
External stakeholders are individuals, groups, or organizations outside a company who are affected by or can influence its activities, decisions, or outcomes. They typically do not work within the organization but have a vested interest in its performance or operations. Examples include:
Clients or Customers: Those who purchase or use the company’s products or services.
Suppliers or Vendors: Entities providing goods or services to the company.
Investors or Shareholders: Individuals or groups funding the company or holding equity.
Partners: Organizations or entities collaborating on projects or initiatives.
Regulators or Government Agencies: Bodies overseeing compliance with laws or regulations.
Community Groups: Local or societal organizations impacted by the company’s actions.
These stakeholders interact with the company externally and play a key role in its success or challenges.
Strategic Leadership & Management
Taneja (2023) and her research associates explain the origins of strategic leadership and management by explaining the discipline as an offshoot of business policy classes taught at the university level. They proceed to cite multiple well-known authors from the early years of strategic leadership investigation as a stand-alone focus area. These authors developed theories and postulations that included a competitive analysis model. They also stressed the importance of strategic management at every level of the organization. One investigation defined companies as market prospectors, defenders, and analyzers as it pertains to the approach to their customers and prospects. Strategic management terms such as plan, ploy, pattern, and perspective were coined as strategy management terminology. Their literature review also defined strategic management as a resource-based discipline. A commonly accepted model of strategic leadership has been labeled as the five P’s. These elements include purpose, principles, processes, people, and performance. Each element is an integral component of the strategic management discipline. Purpose is the direction of the organization defined by the missions, vision, goals, and strategies established by the leadership of the entity. Principles are core values that are established as unwavering guidelines for the operation of the organization. Processes are a necessary definition of the manner in which work teams achieve goals. People are normally considered as the individual employees who perform the work. Performance relates to an individual’s measurement of effort and the results they achieve.
This paper proceeds to state that there are eight impactful issues facing strategic leaders in the current business environment. They are listed as: 1) technology, 2) globalization, 3) diversity, 4) ethics, 5) innovation, 6) security,7) terrorism, and 8) violence in the workplace. Technology is acknowledged as an undeniable aspect of strategic management in both the internal operations perspective and externally with customer and suppliers. The ability to be agile is dependent on the intelligent application of technology available in the marketplace. Globalization is the awareness that businesses function in a globally competitive environment. That opens opportunities and it also constrains possibilities due to the intense competition thrust on them by globalization. Globalization adds complexity to strategic management decision making because of logistics, cultural issues, costs, trade agreements, and tariff duties. Security has two elements that must be taken into consideration. Information technology is a critical function that includes data breaches and intellectual property security. The second element is the physical security of both the employees and the physical plants where business is conducted. Terrorism is listed as a concern that impacts governments and business organizations as well. This involves the ability to deal with threats and terroristic actions as well. Diversity has become an area of concern due to the diversification of the workforce on a global basis. The organization must think in terms of education, function, industry, and organizational background when they choose senior leadership and production level employees. This should aid in keeping the organization competitive. Ethics has surfaced as an area of concern because of the ethical broaches that have cost organizations in matters of reputation and revenue. Strategy managers must develop and implement ethical policies to communicate expectations among the business managers in the organization. An ethical culture is necessary to ensure the successful long-term survival of the organization. Innovation is an element that must be purposefully fostered to increase creativity in organizations. Strategic leaders must ensure that strategy, structure, culture, values, and performance criteria are developed and aligned with the vision of the organization. Violence in the workplace encompasses workplace safety and crisis management. It is the responsibility of organizational leaders to develop and implement a prevention and response system that has the right structure and consistency for handling behaviors and conditions that could endanger worker safety.

